About the Mock Catalog
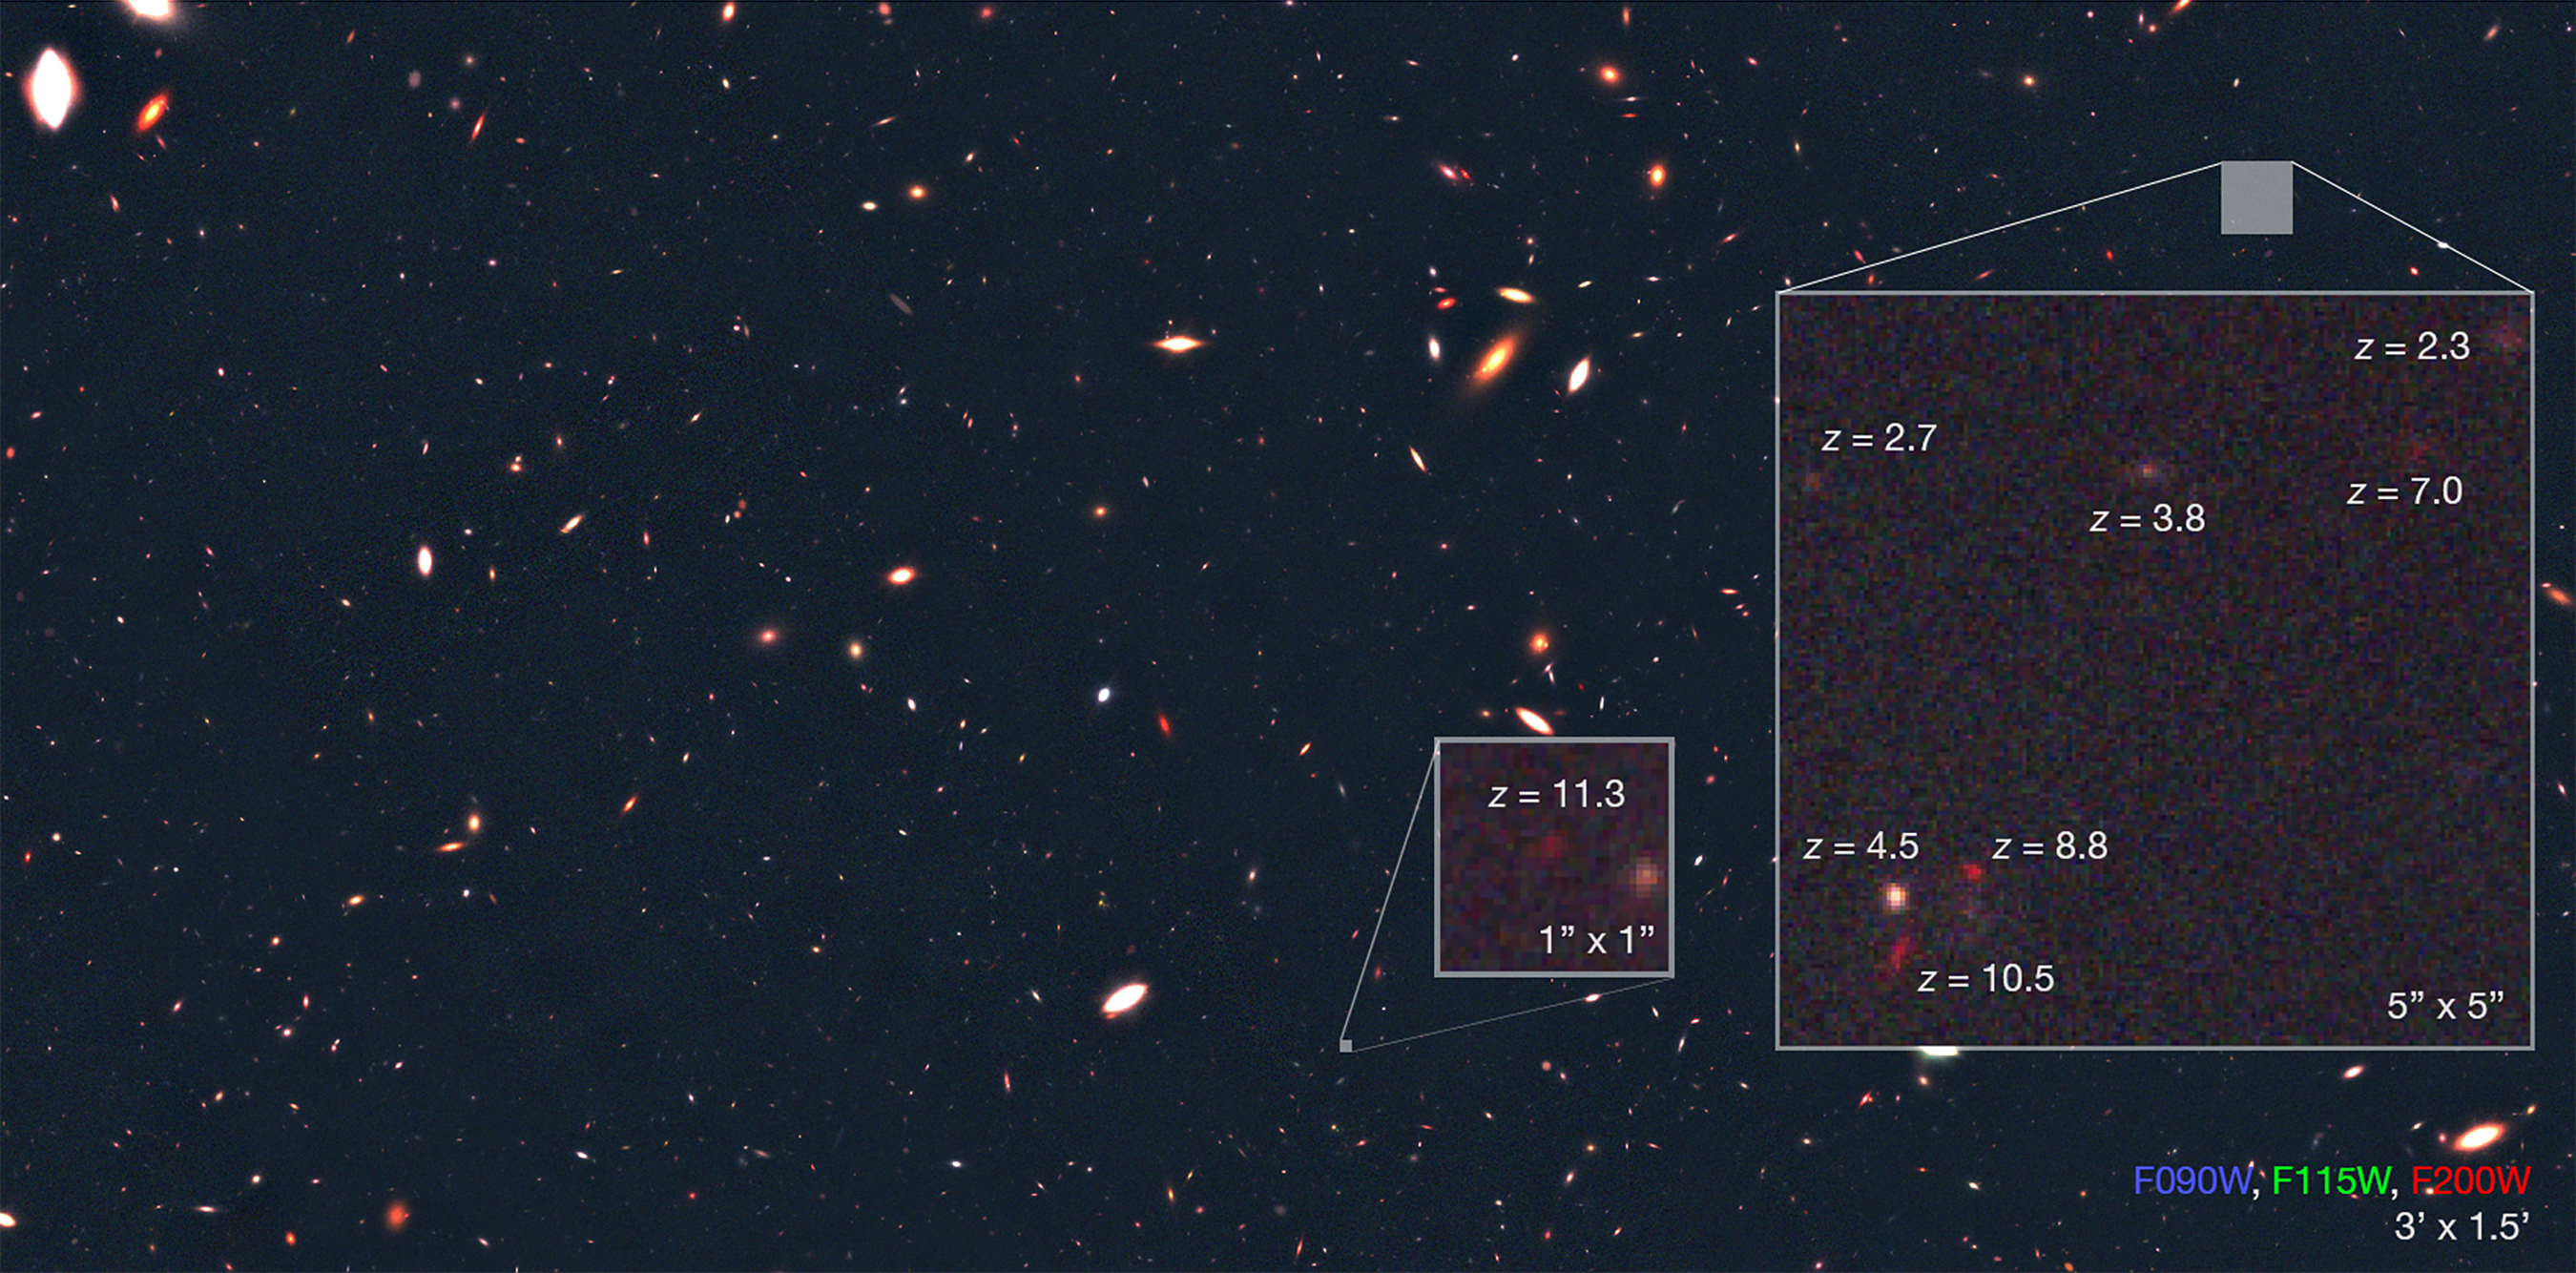
Image created from a mosaic of three filters created using v1.1 of the mock catalog, by Christopher Willmer.
From Mass Functions to Number Counts
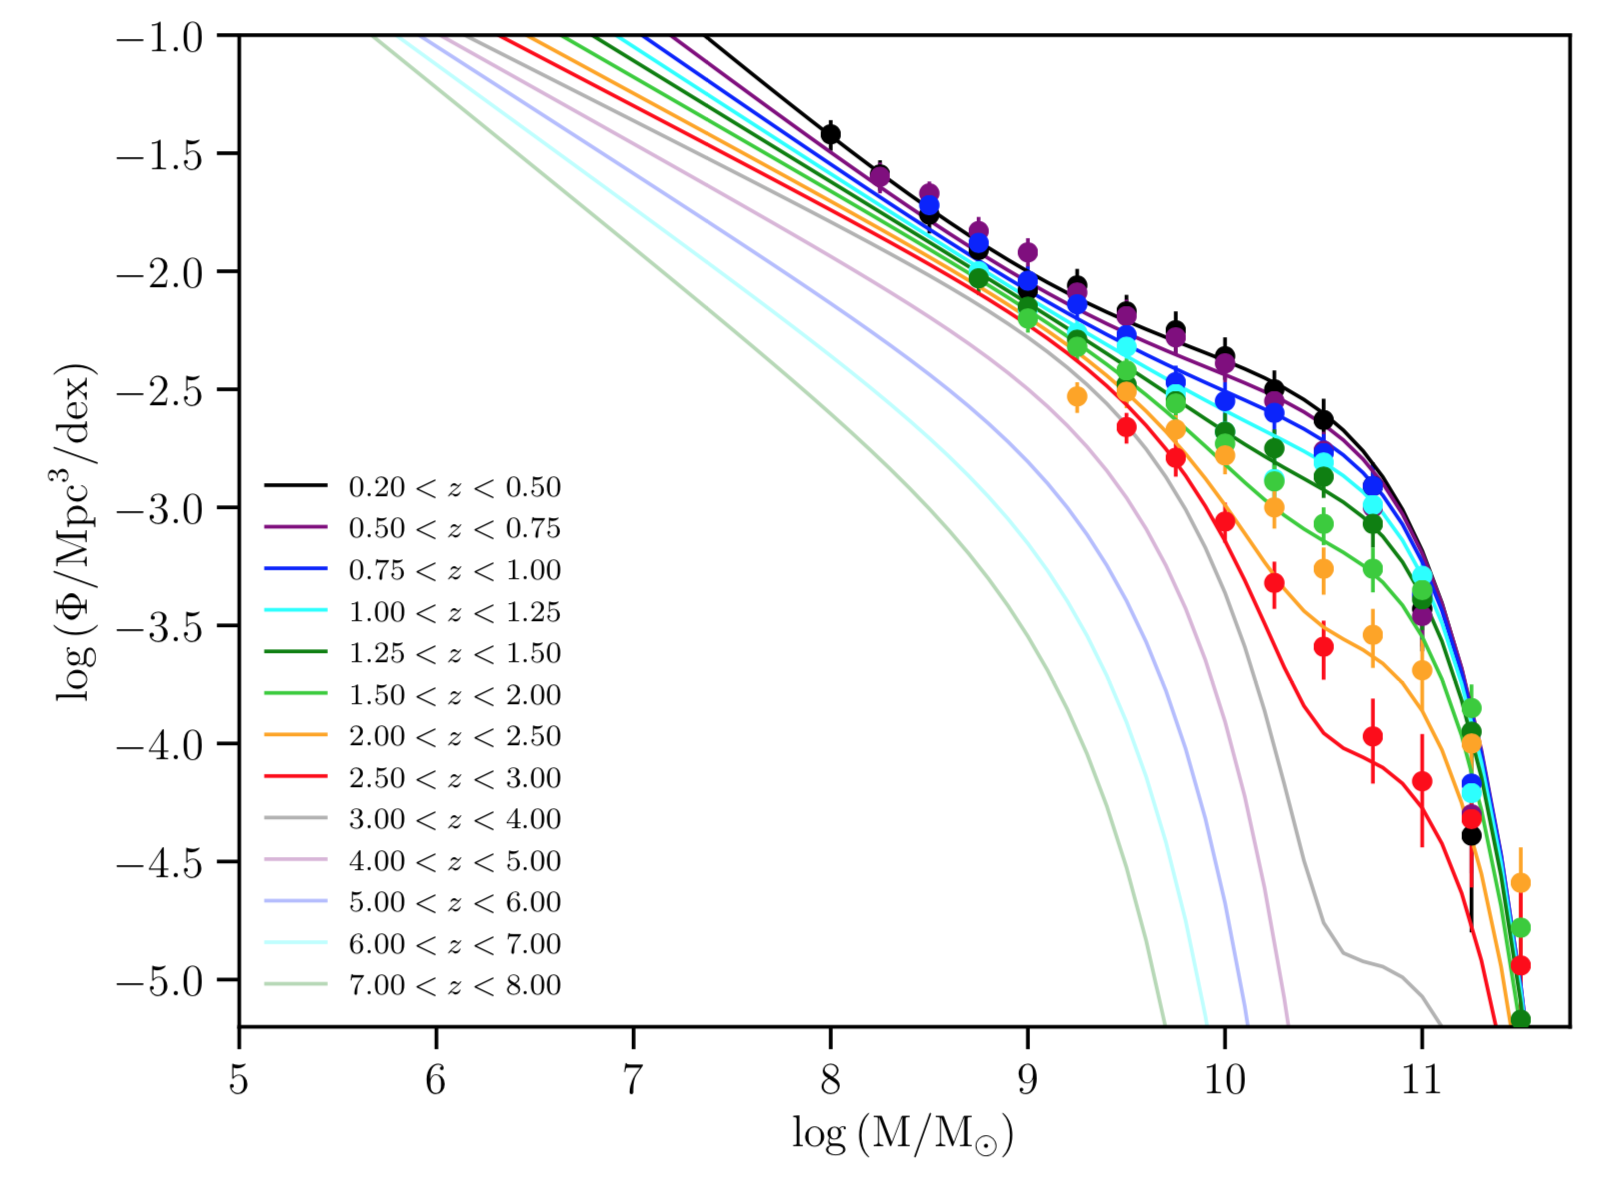
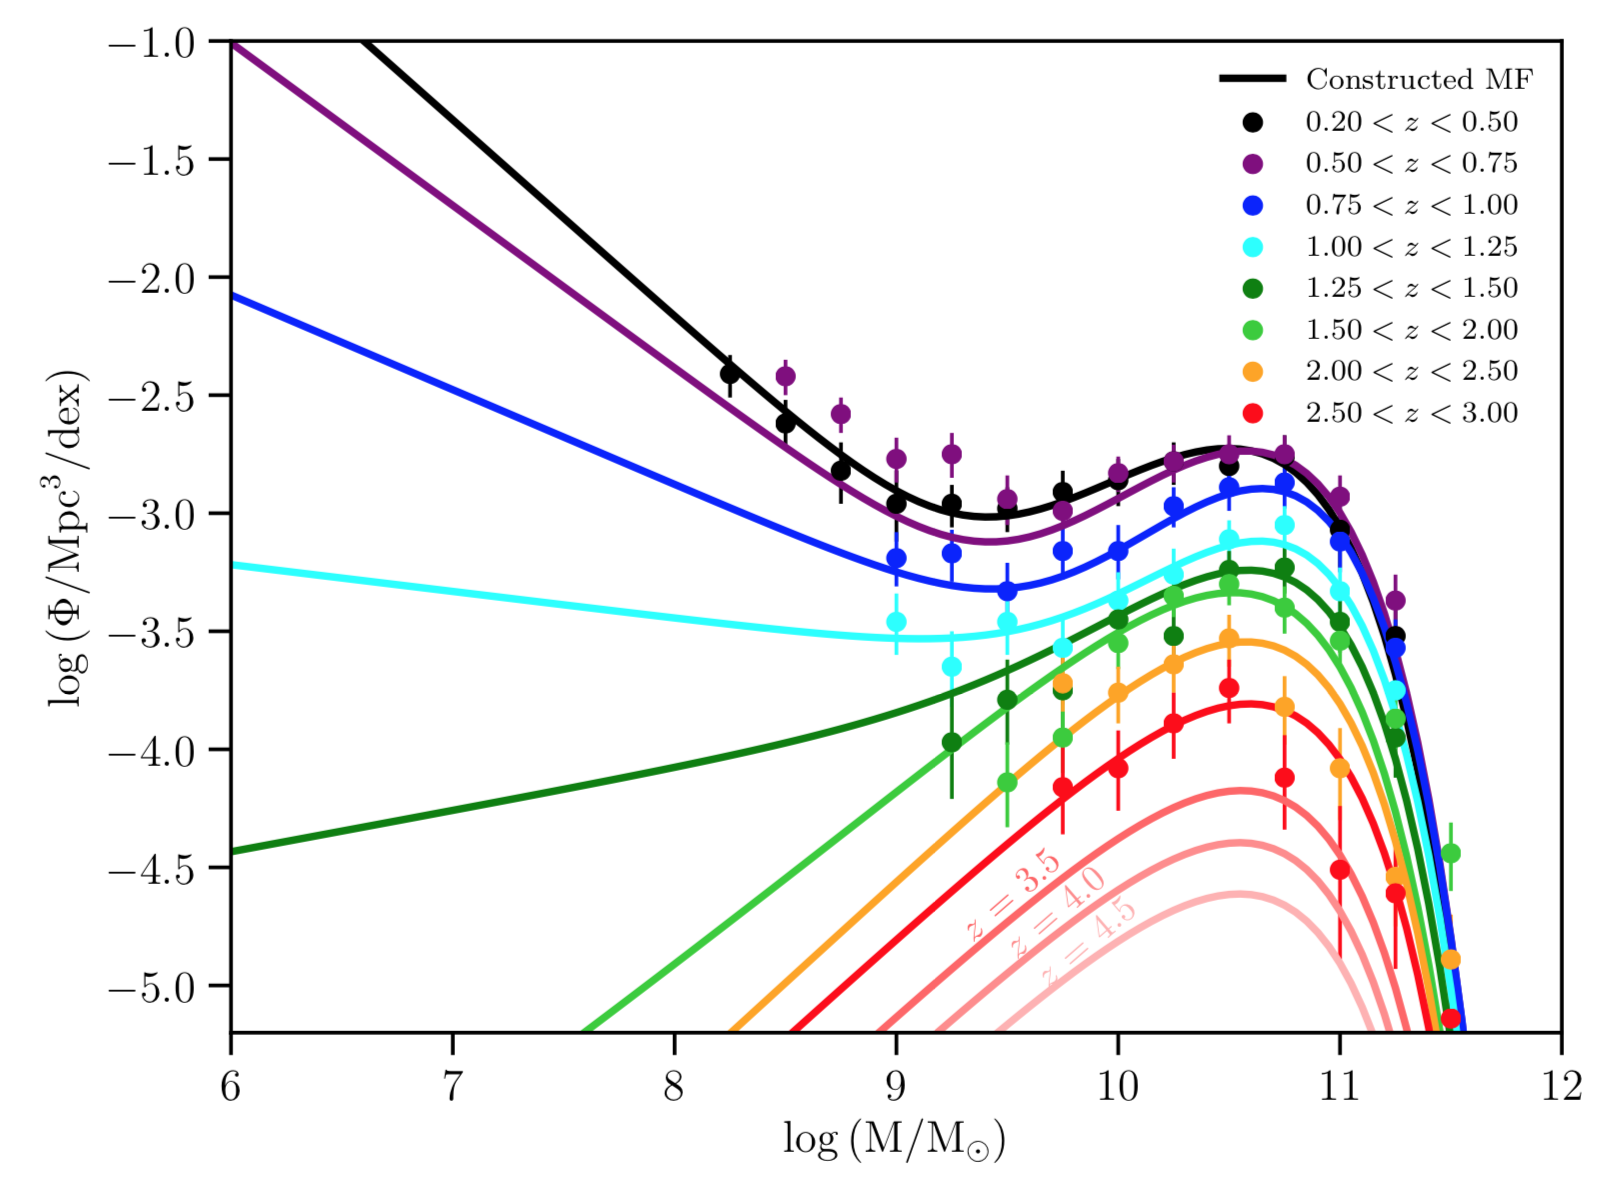
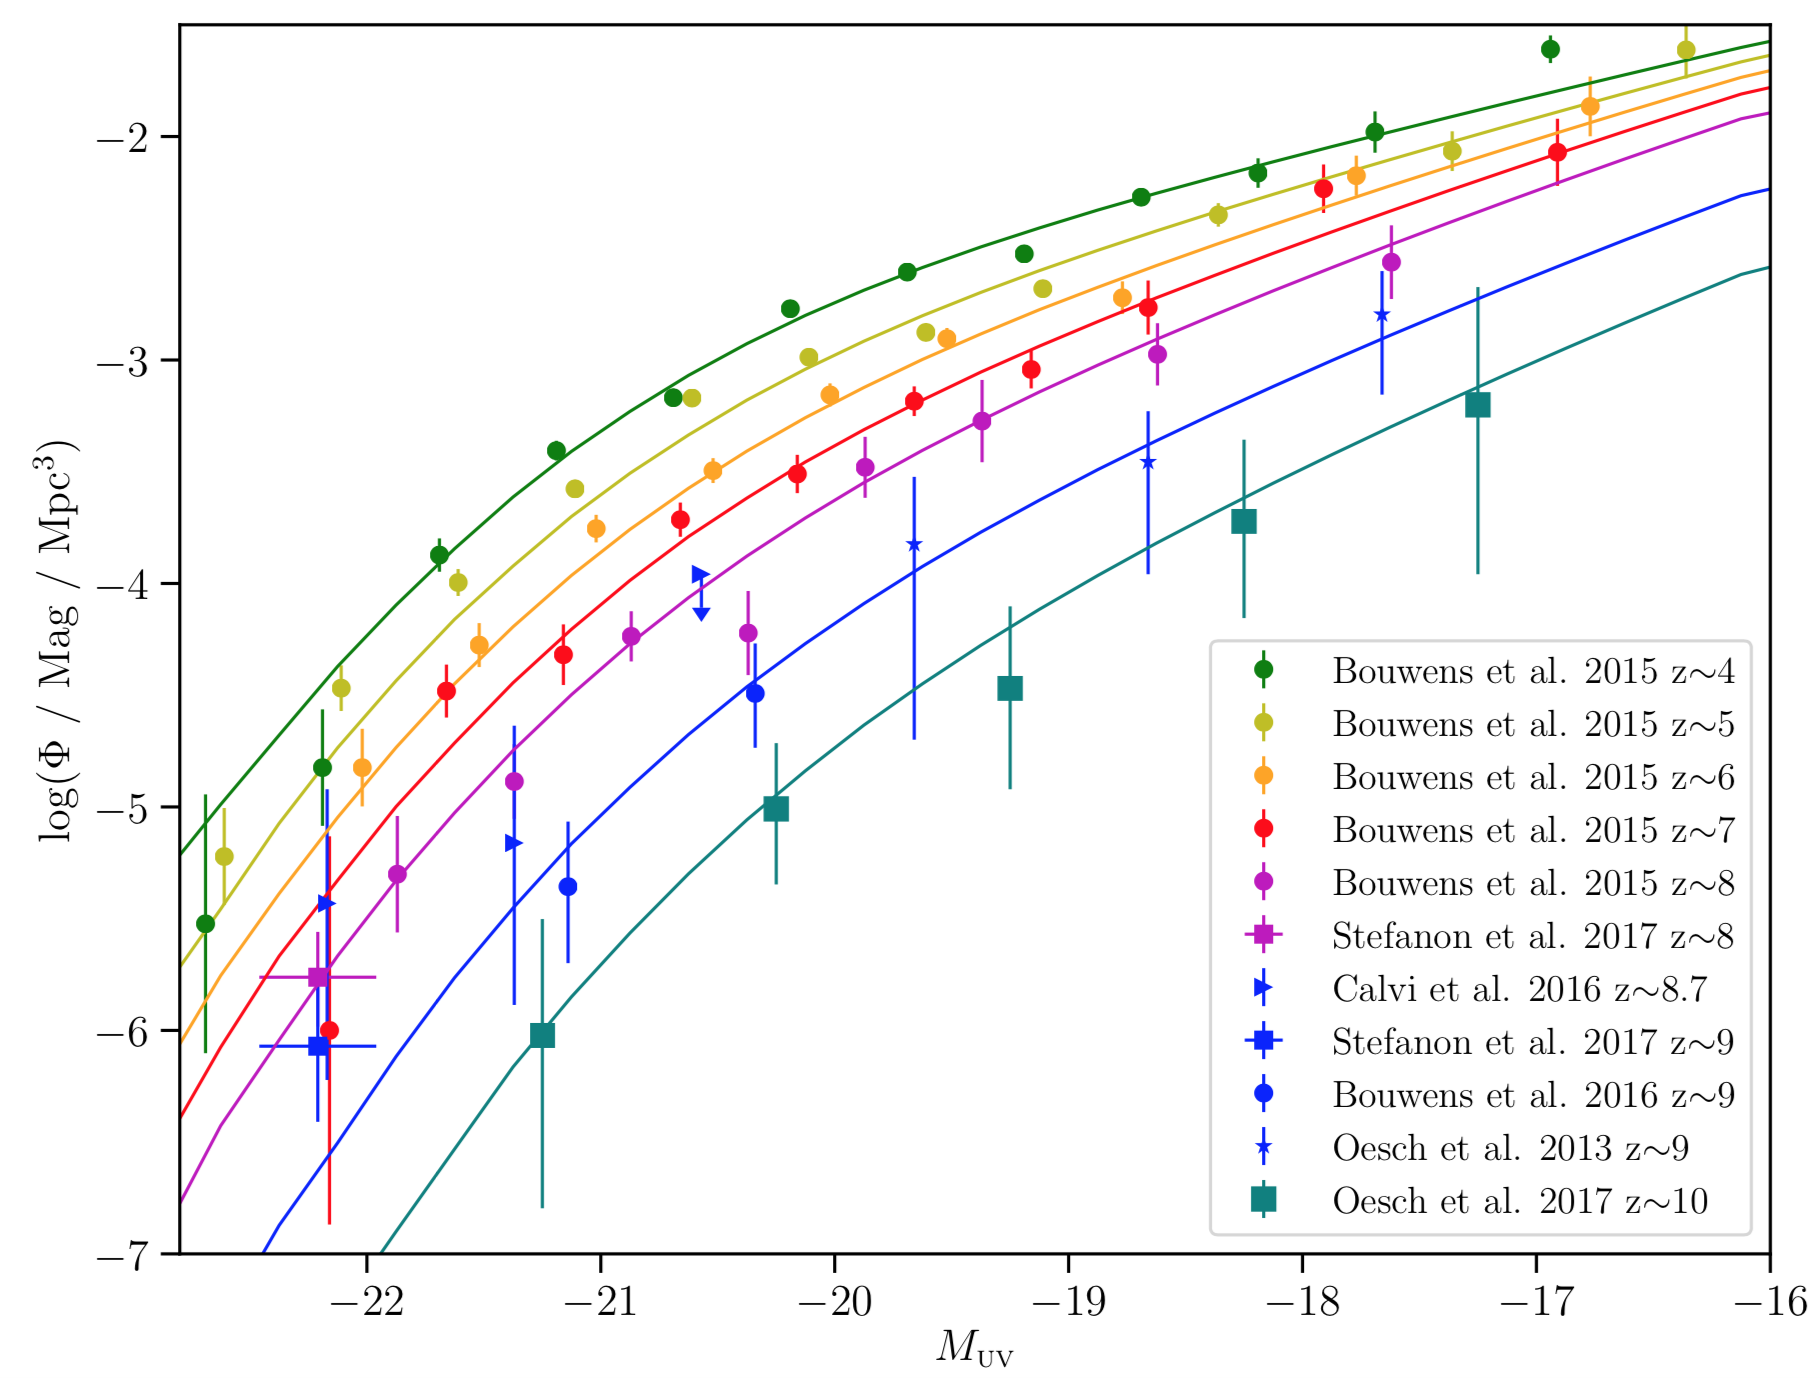
The foundation of the mock catalog is mass functions derived from the observations from Tomczak et al. (2014). These were derived for both star-forming and quiescent galaxies at low redshift. For the star-forming galaxies, the MFs were extrapolated to high redshift such that the UV luminosities for the objects matched observed LFs from Bouwens et al. (2015) and , Stefanon et al. (2017), Calvi et al. (2016), Bouwens et al. (2016), and Oesch et al. (2013, 2017). For the quiescent galaxies, our derived number counts agree with the predictions from Straatman et al. (2014) at high redshift.
The mass function evolution for star-forming (left) and quiescent (right) galaxies is shown below:
And the resulting LFs are shown below:
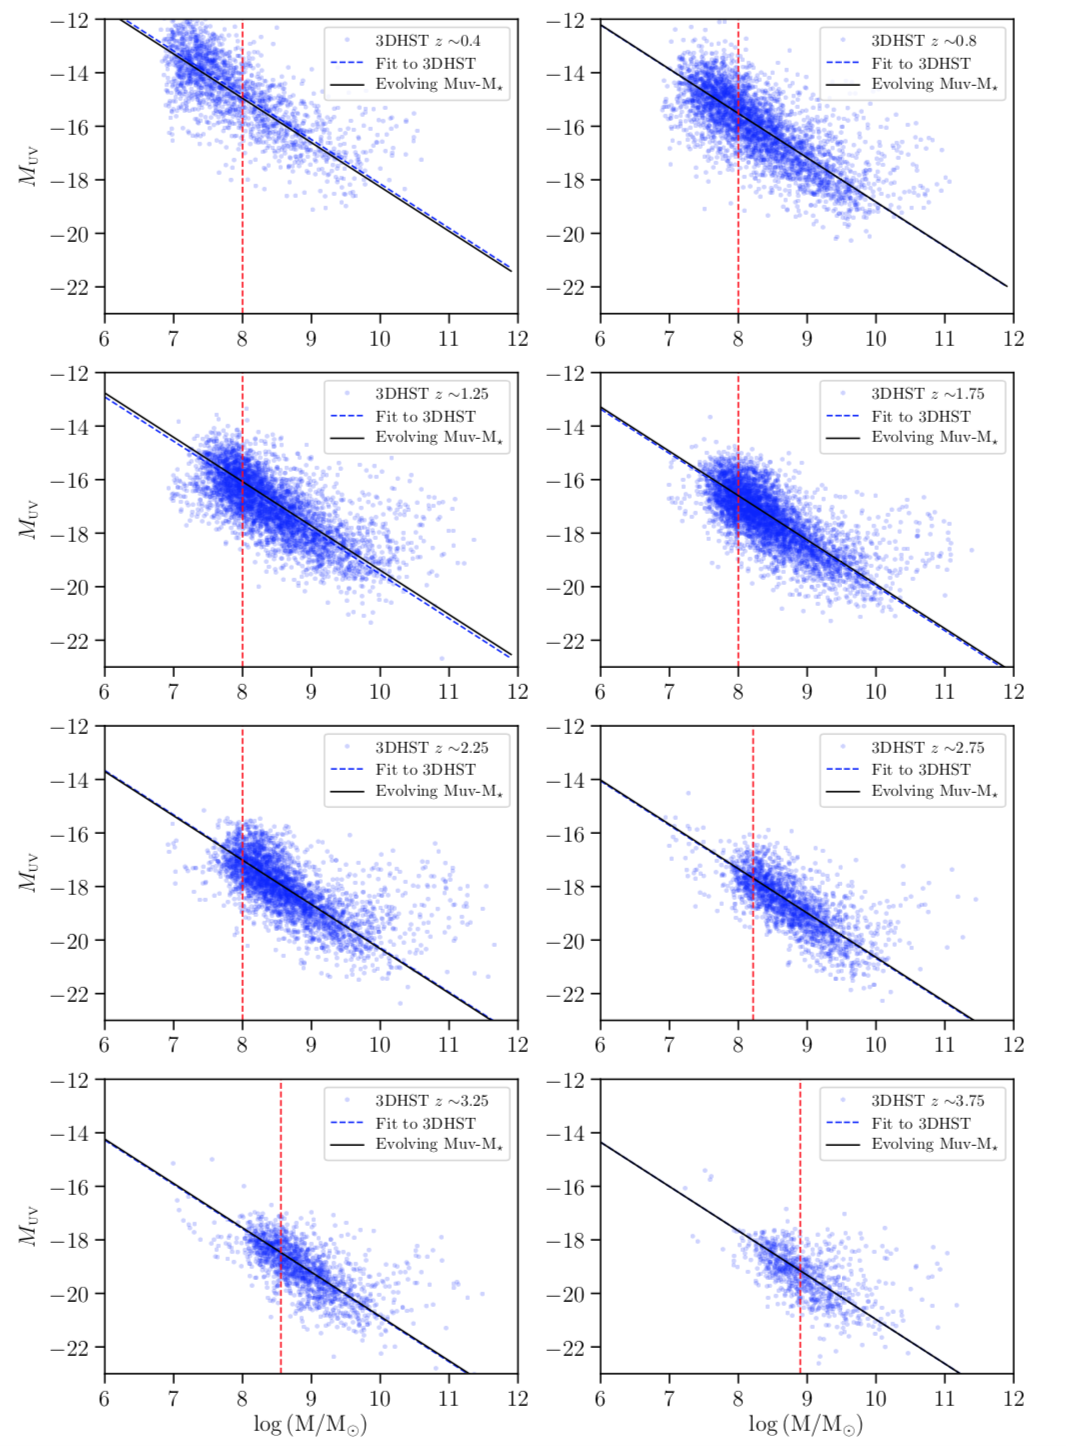
To go from masses to luminosities, we fit observations from 3D-HST for both stellar masses and UV magnitudes to create a prescription for the evolution of the Mᵤᵥ vs. M* relationship:
In addition, we use observations of the UV slope β as a function of redshift to assign values to the objects in our mock catalogue based on their UV magnitude, following Bouwens et al. (2009, 2014).
Creating SEDs for the Mock Objects
For every galaxy in our catalog, we assign a set of spectral properties, which allows us to provide a full spectrum and the associated filter photometry. Roughly, we create a grid of model SEDs using the BEAGLE code (Chevallard et al. 2017) that are then matched to objects based on their redshift and mass, and in the case of the star-forming objects, their UV slope and Mᵤᵥ.Furthermore, for objects with log(M*) > 8 and and z < 4, we match the galaxies in our catalog to objects from the 3D-HST catalog, and use BEAGLE fits to their photometry to provide an SED. For lower mass galaxies at these redshifts, and for all galaxies at z > 4, we rely on extrapolations of observed relationships to provide physically motivated constraints on the SED.
Galaxy Morphologies
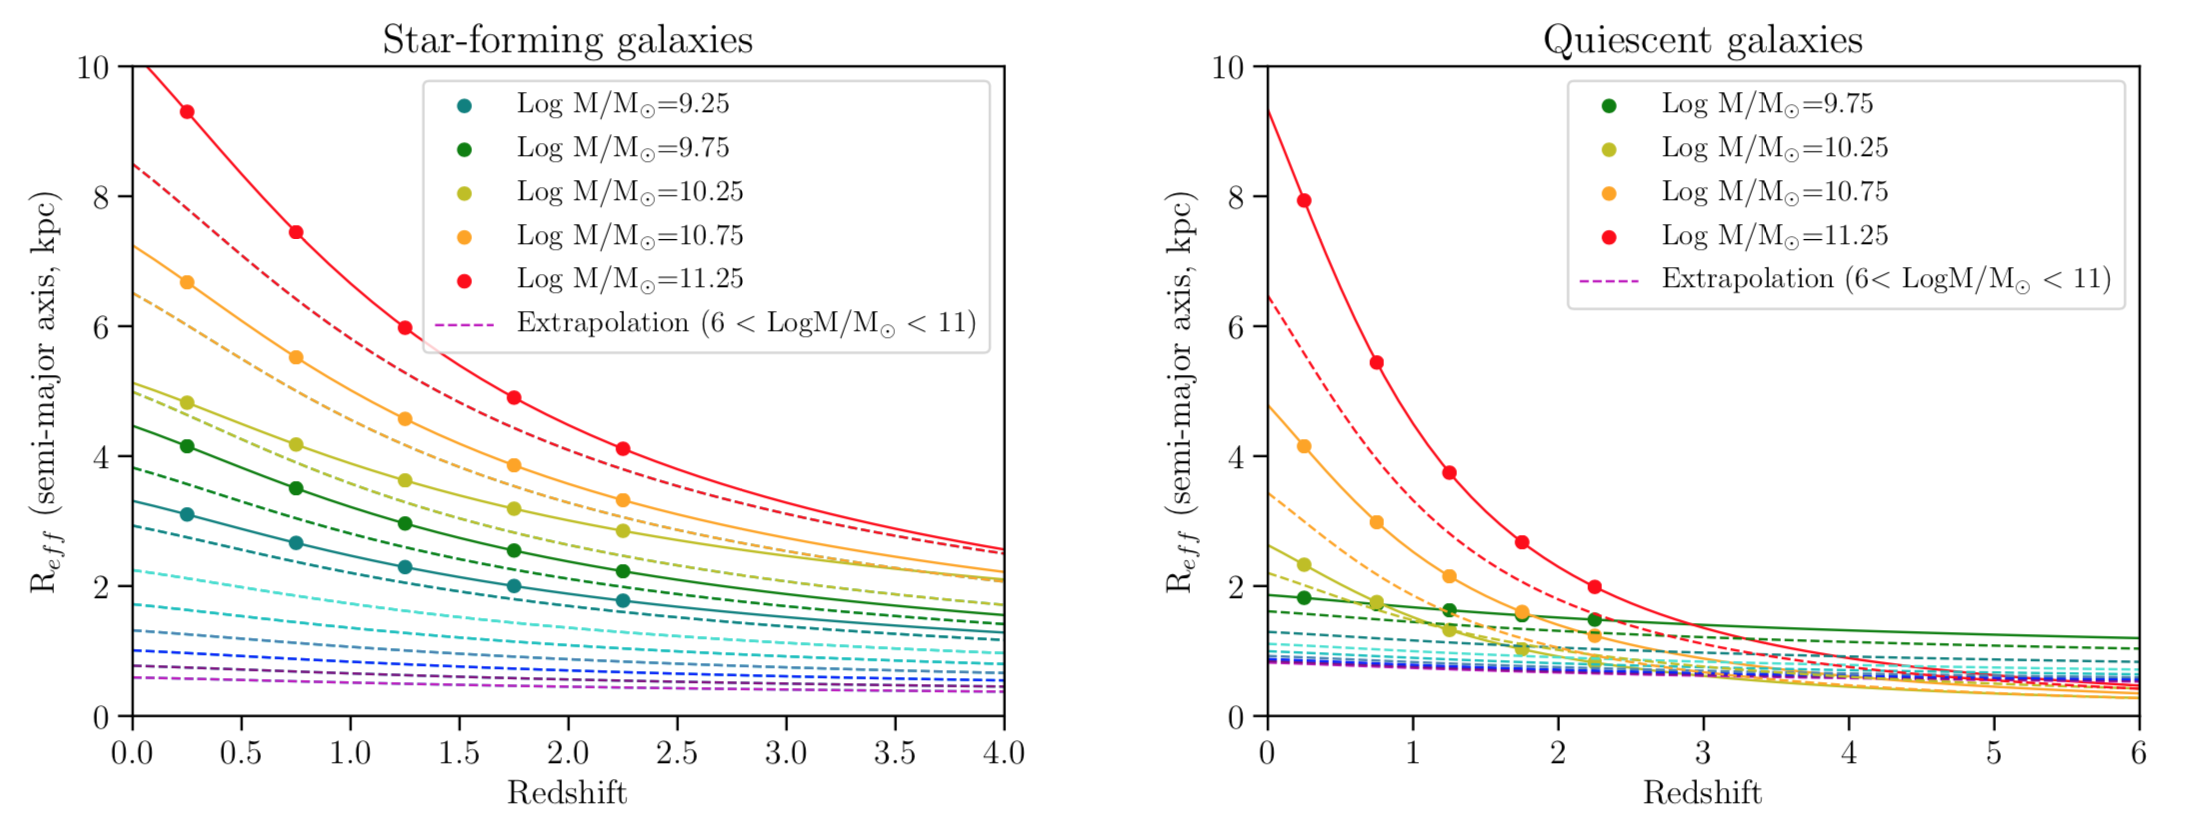
Galaxy morphologies were assigned to the star-forming and quiescent galaxies separately using observed relationships from the literature, extrapolated down to log(M*) ~ 6. For each object, we model it as a simple Sersic profile, and provide in our catalog the Sersic index, position angle, axis ratio, and two sizes, circularized half-light radius (in kpc) and semi-major half-light radius (in arcseconds).
Here, we plot our model describing the variation of the effective radius of the semi-major axis as a function of redshift and stellar mass (with dashed lines) compared to the evolution from van der Wel et al. (2014), as measured from CANDELs data:
Comparisons to Observations
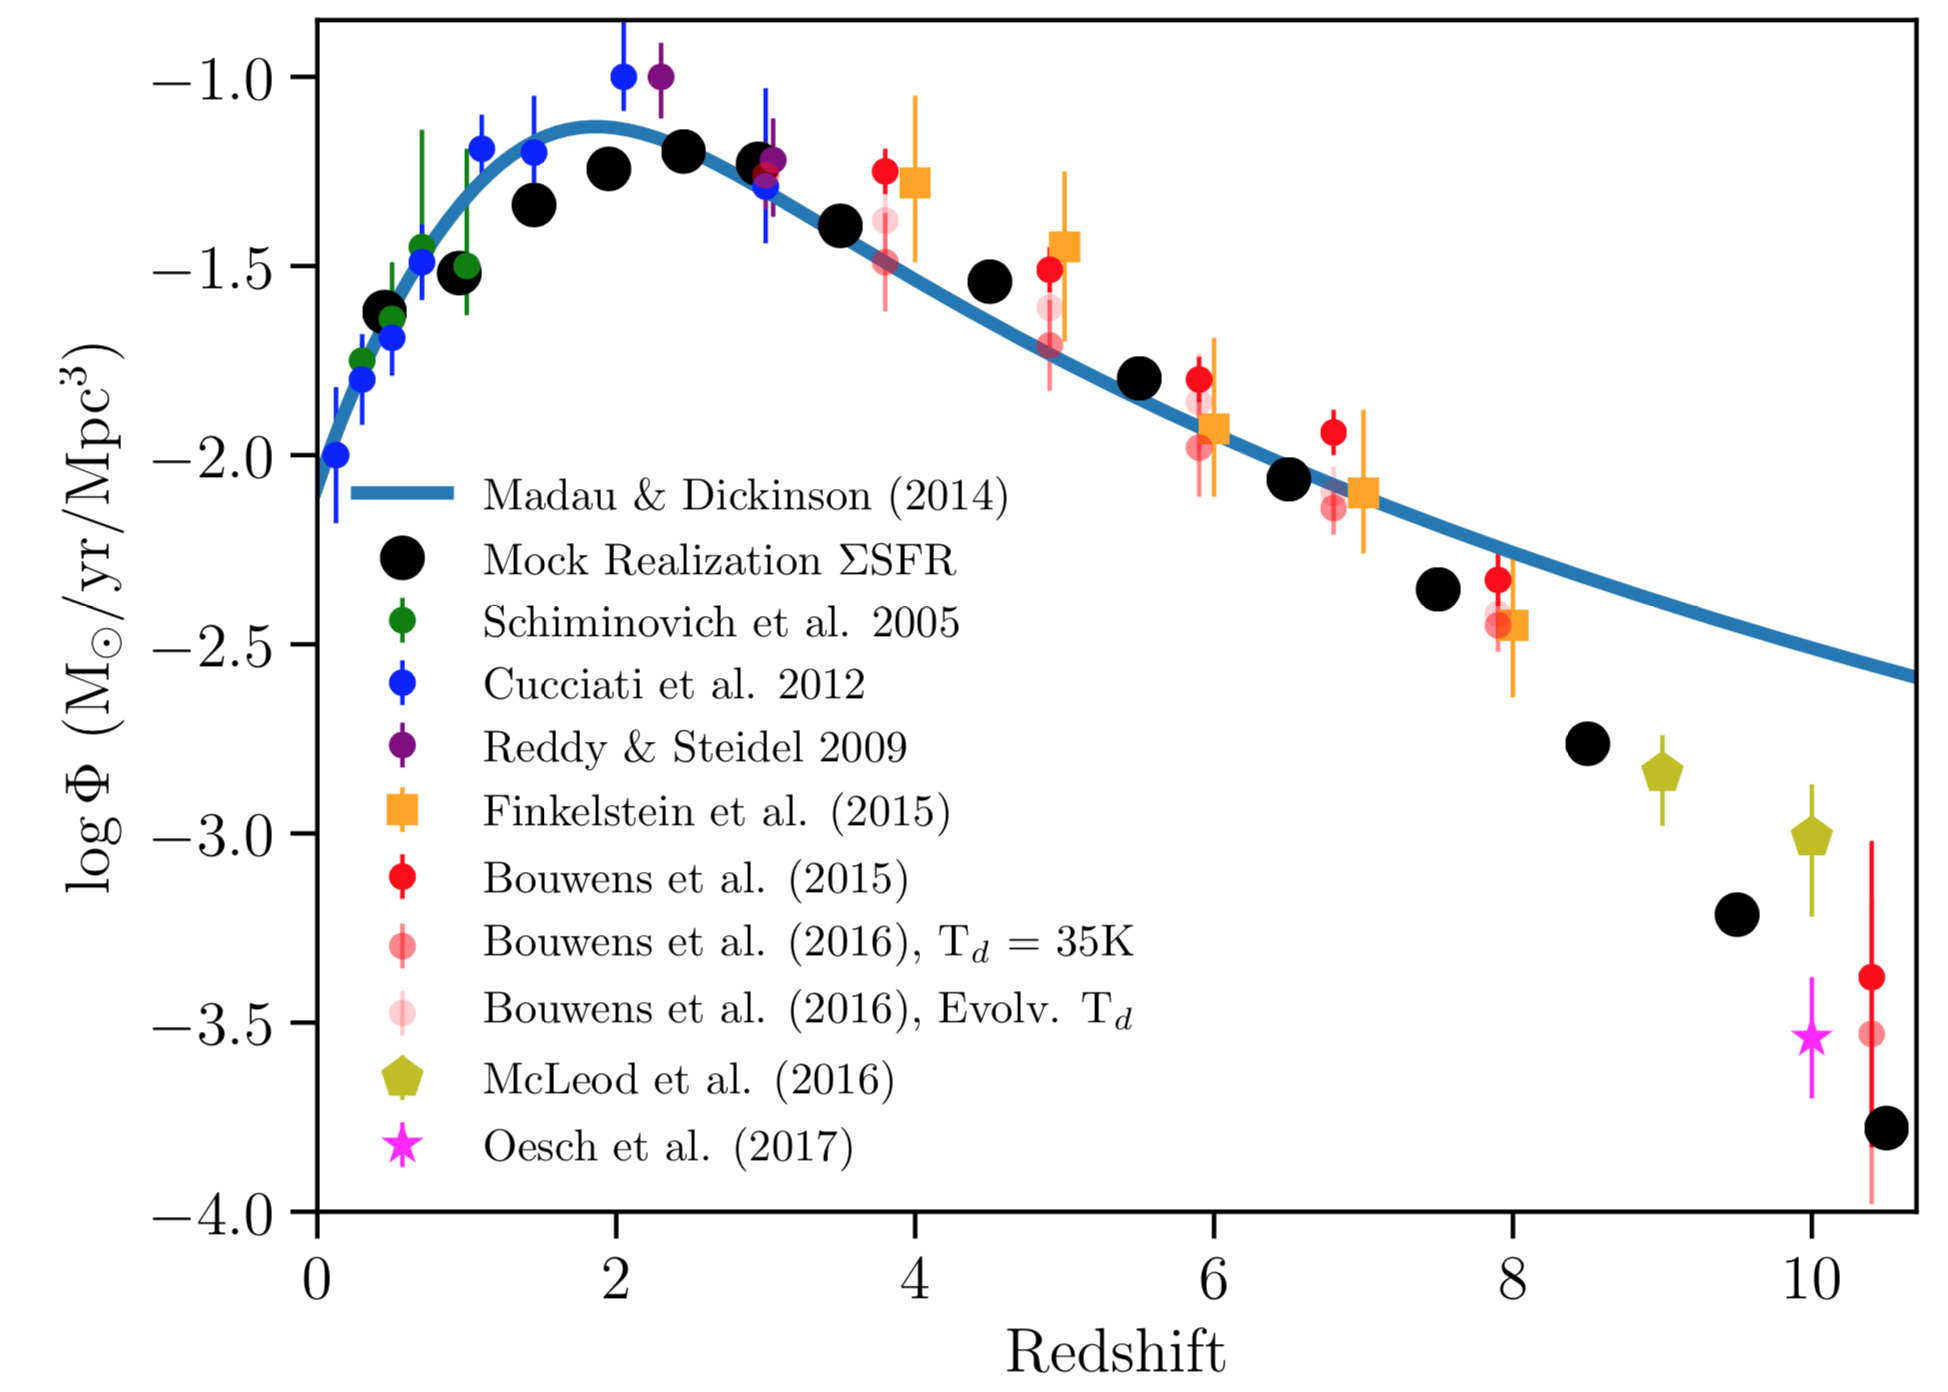
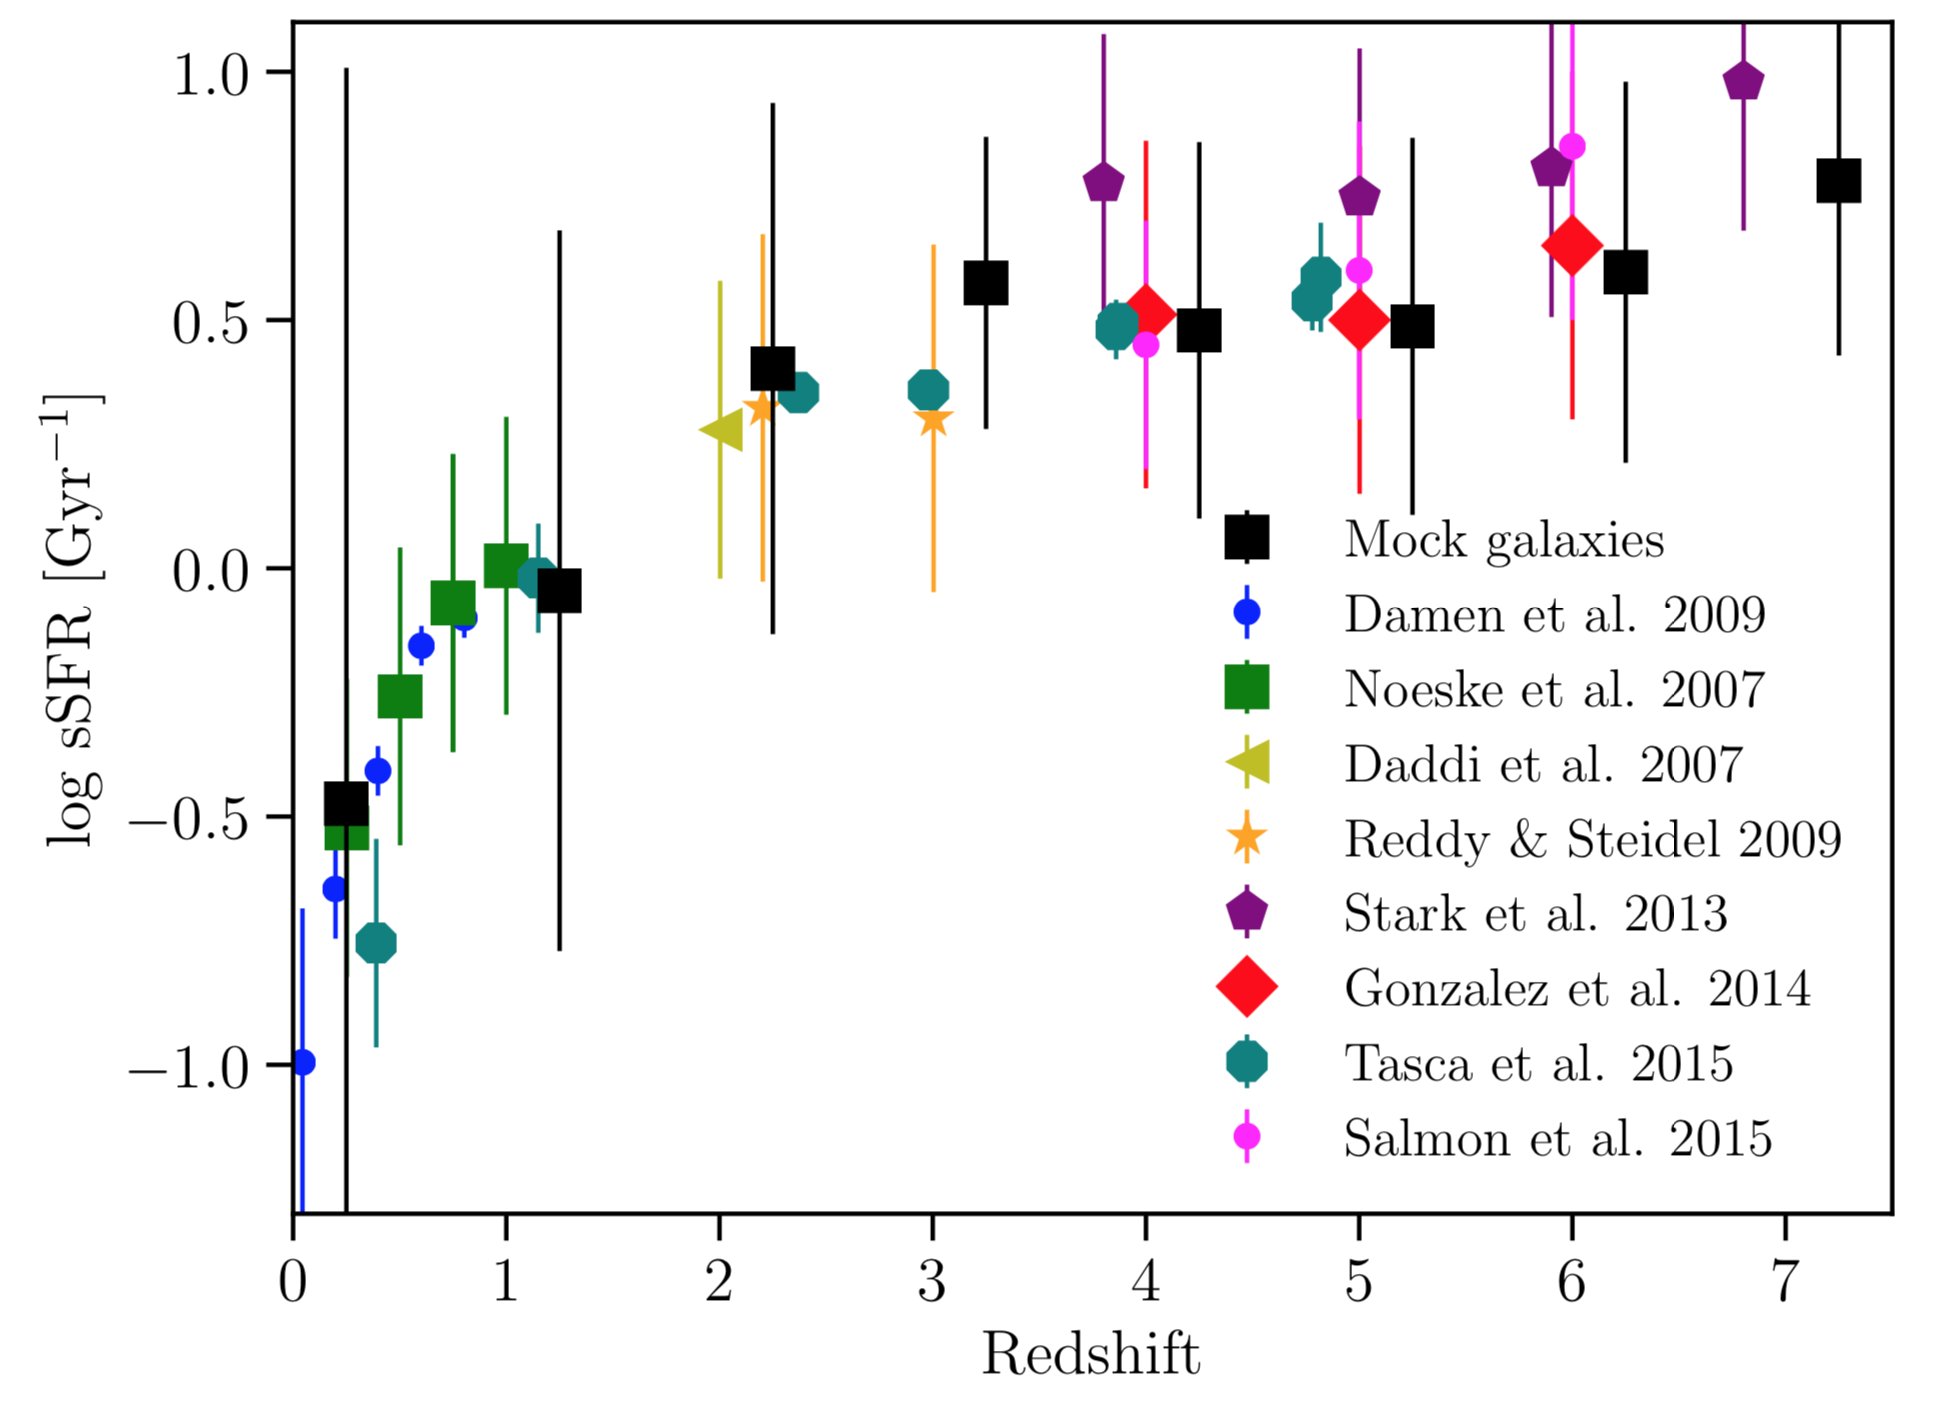
Below, in the left panel, we compare the derived star formation rate densities (derived, as in the observations, by integrating the UV luminosities (corrected for dust) from the mock galaxies in the catalog. These are shown compared to observations from the literature, integrated down to Mᵤᵥ > −17. In the right panel, we show the specific Star Formation Rate (sSFR) for objects in the mock catalogue against observations from the literature.
JADES Survey
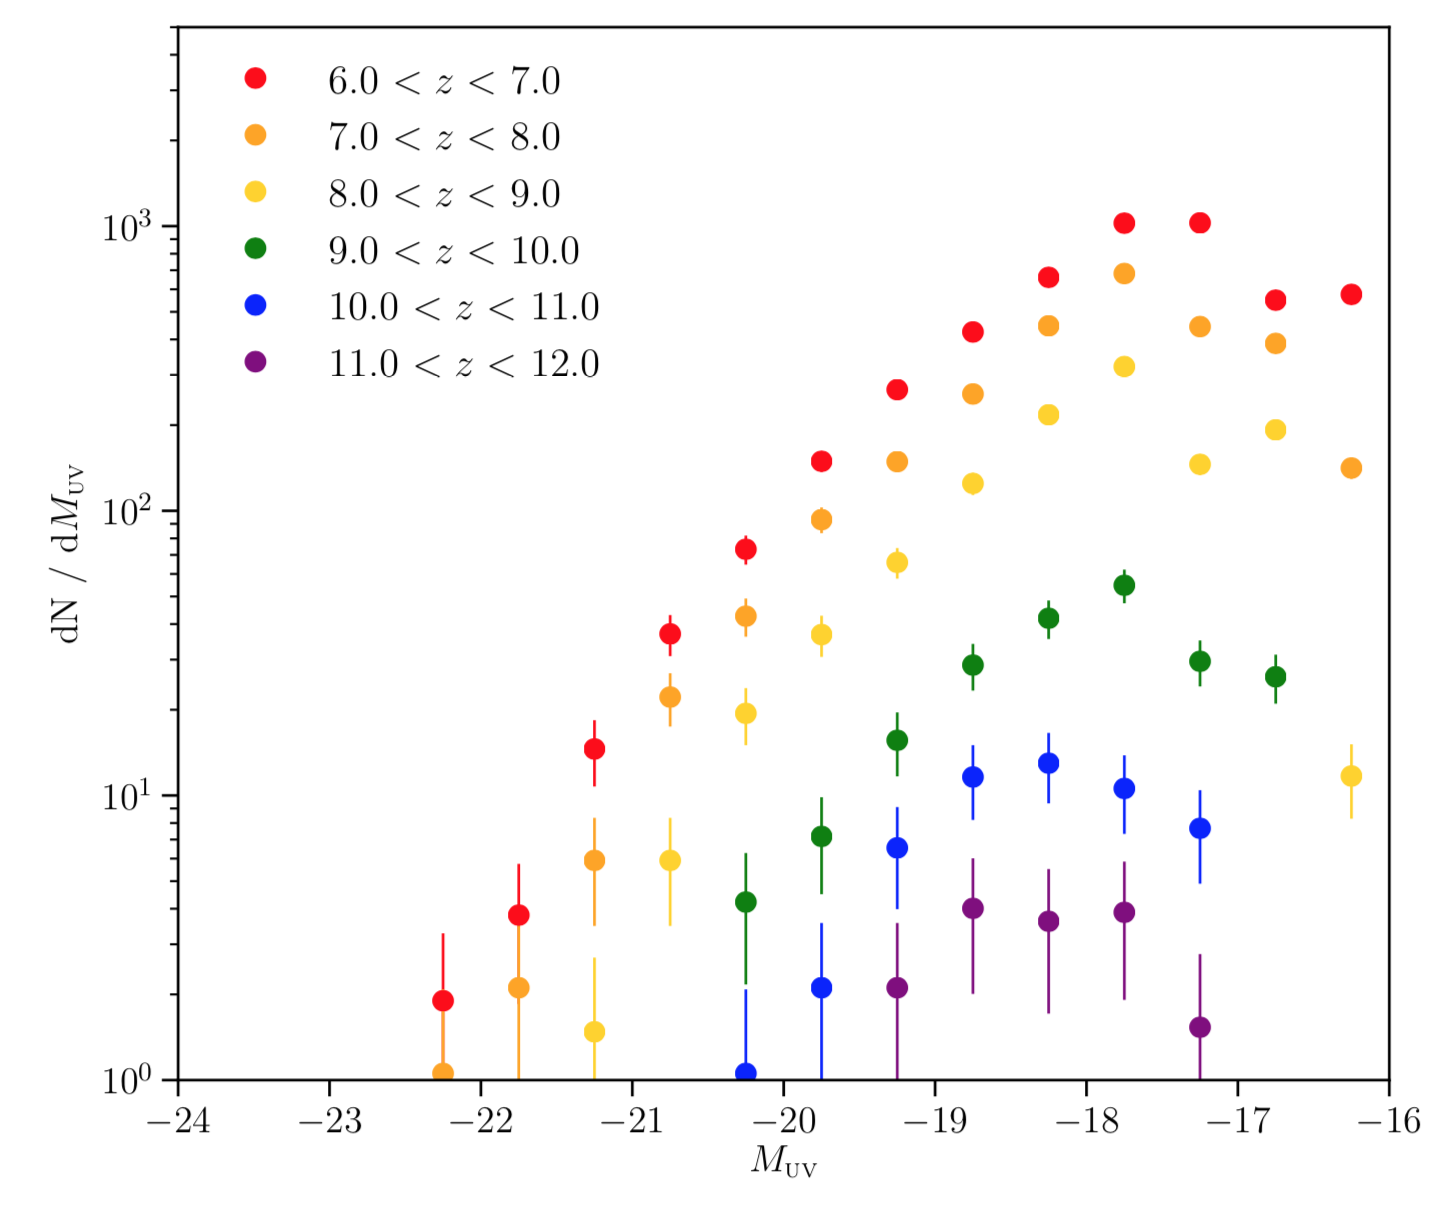
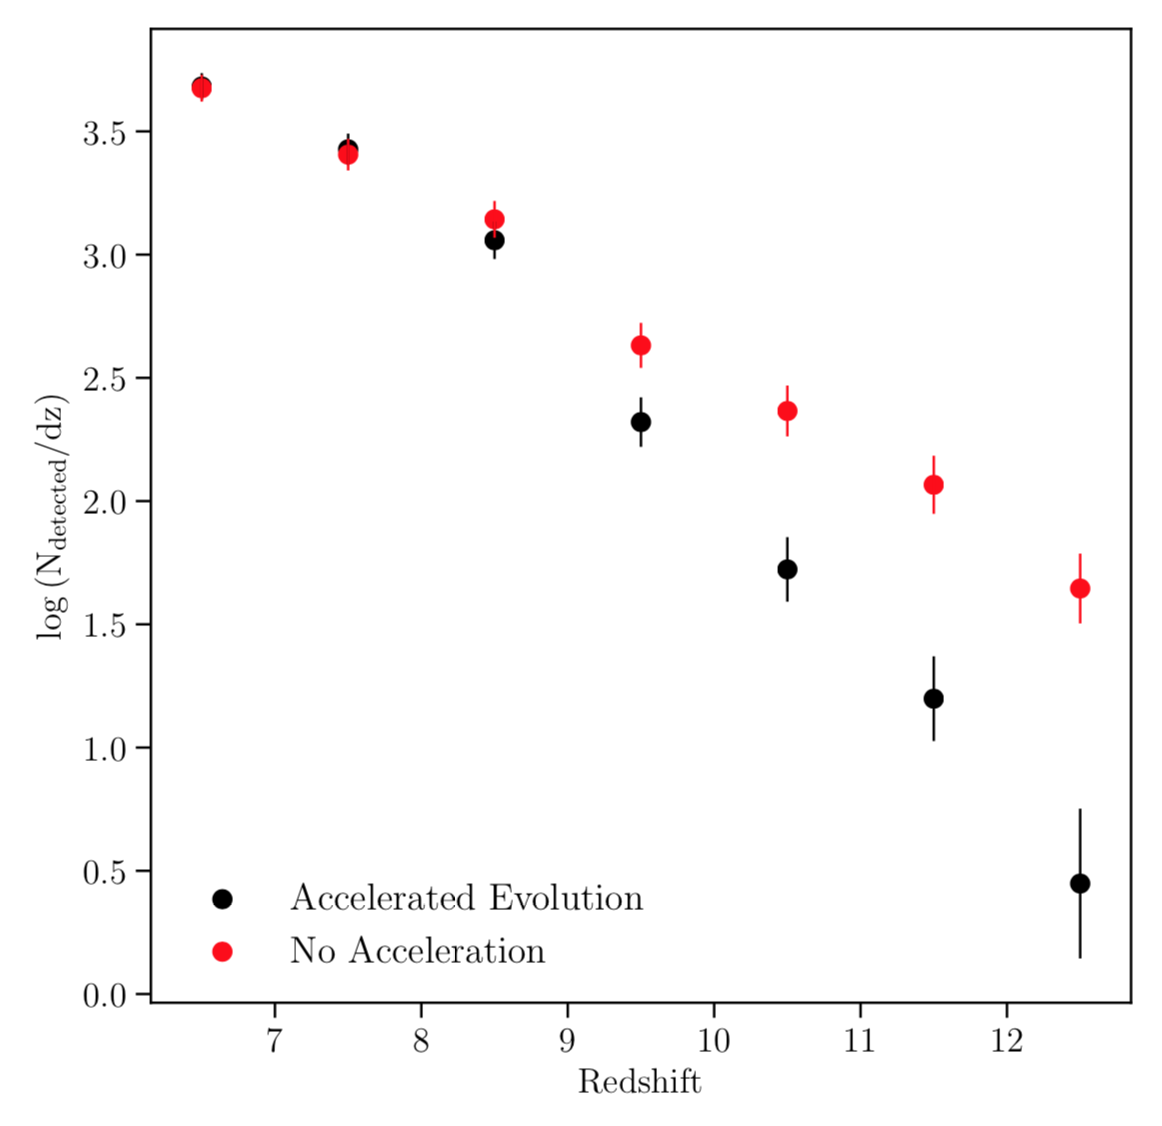
The mock catalog can also be used to explore the properties of galaxies observed at the depths of the JWST Advanced Deep Extragalactic Survey (JADES), the NIRCam / NIRSpec Joint GTO observing program. On the left, we show the expected number counts as a function of Mᵤᵥ and redshift for the high-redshift objects in the survey. On the right, we plot the total number of galaxies we will detect in JADES as a function of redshift. The red points are based on the non-accelerated LF evolution from Bouwens et al. (2015), and the black points are based on an accelerated LF evolution from Oesch et al. (2017). We expect to detect hundreds of galaxies at z > 7.